3.2. System Latency Analysis
As mentioned in Section 3.1, LinuxCNC requires a real-time operating system (RTOS), a type of operating system designed for real-time device and process control. Unlike traditional operating systems, RTOSs are engineered to ensure that critical tasks are completed within strict time limits. These systems are needed in applications where response time is vital, such as industrial control systems, aircraft navigation systems, and automotive anti-lock braking systems, among others.
There are two primary types of real-time operating systems:
Soft Real-Time Systems: In these systems, critical tasks generally meet their deadlines, but occasional missed deadlines do not lead to severe consequences. These systems prioritize speed and efficiency, allowing some flexibility in timing.
Hard Real-Time Systems: These systems enforce absolute and strict time limits. Critical tasks must be completed within a precise timeframe; otherwise, catastrophic consequences could occur. Hard real-time systems are common in safety-critical applications.
As noted in Section 3.1, our system uses a Linux operating system with PREEMPT_RT patches to add real-time capabilities. This is a soft real-time system, meaning that occasional deviations from the scheduled execution intervals of processes may occur. In this context, the critical factor to analyze is latency, or jitter, which refers to temporal variations in task execution intervals.
Historically, one of the most common methods for controlling stepper motors in LinuxCNC has been the software generation of step pulses. In such cases, very low latency, ideally less than 20 μs, is essential to generate pulses frequently enough for precise and consistent motor movement at the required speeds.
In our setup, where MESA boards are used to generate motor control signals, a communication interval of 1 ms is typically sufficient, making latency less critical than in the previous scenario. Here, a maximum latency of 200 μs can be acceptable.
Before running LinuxCNC to control machinery, we should analyze the maximum system latency and confirm that it is adequate. For this purpose, LinuxCNC includes the following tools:
Latency Histogram:
latency-histogramLatency Plot:
latency-plotLatency Test:
latency-test
Important
LinuxCNC must not be running when these tools are in use.
Important
To determine the maximum latency, the latency histogram or latency test are the most suitable tools. It is advisable to perform the test for at least several minutes. During the test, the computer should be subjected to a significant load. For example, the LinuxCNC user manual recommends moving windows across the screen, browsing the web, copying large files to disk, playing music, and running intensive programs like glxgears in OpenGL.
These tools consider two threads:
A fast thread, known as the “base thread,” with a default period of 25 μs.
A slower thread, known as the “servo thread,” with a default period of 1 ms.
The following sections describe each of these tools.
3.2.1. Latency Histogram
The latency-histogram tool displays a latency histogram for the “base thread” and “servo thread.” The available command options are shown in the tool’s help text in Listing 1. The tool’s graphical interface is shown in Fig. 16.
Usage:
   latency-histogram --help | -?
or
   latency-histogram [Options]

Options:
  --base      nS   (base  thread interval, default:   25000, min:  5000)
  --servo     nS   (servo thread interval, default: 1000000, min: 25000)
  --bbinsize  nS   (base  bin size,  default: 100)
  --sbinsize  nS   (servo bin size, default: 100)
  --bbins     n    (base  bins, default: 200)
  --sbins     n    (servo bins, default: 200)
  --logscale  0|1  (y axis log scale, default: 1)
  --text      note (additional note, default: "")
  --show           (show count of undisplayed bins)
  --nobase         (servo thread only)
  --verbose        (progress and debug)
  --nox            (no gui, display elapsed,min,max,sdev for each thread)

Notes:
  Linuxcnc and Hal should not be running, stop with halrun -U.
  Large number of bins and/or small binsizes will slow updates.
  For single thread, specify --nobase (and options for servo thread).
  Measured latencies outside of the +/- bin range are reported
  with special end bars.  Use --show to show count for
  the off-chart [pos|neg] bin
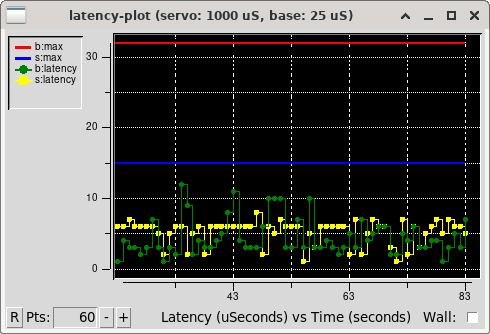
Fig. 15 LinuxCNC latency plot tool.
3.2.2. Latency Plot
The latency-plot tool displays a latency plot for the “base thread” and “servo thread.” The available command options are shown in the tool’s help text in Listing 2. The tool’s graphical interface is shown in Fig. 15.
Usage:
      latency-plot --help | -?      (this)
      latency-plot --hal [Options]

Options:
      --base nS  (base  thread interval, default:   25000)
      --servo nS (servo thread interval, default: 1000000)
      --time mS  (report interval, default: 1000)
      --relative (relative clock time (default))
      --actual   (actual clock time)
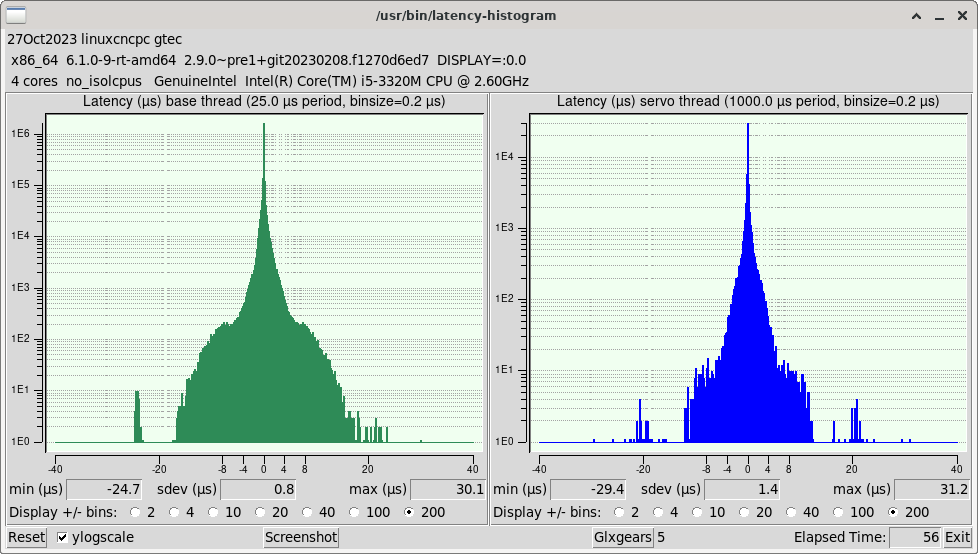
Fig. 16 LinuxCNC latency histogram tool.
3.2.3. Latency Test
The latency-test tool runs a latency test for the “base thread” and “servo thread,” reporting the interval and maximum latency for each. The available command options are shown in the tool’s help text in Listing 3. The tool’s graphical interface is shown in Fig. 17.
Usage:
       latency-test [base-period [servo-period]]
   or:
       latency-test period -      # for single thread
   or:
       latency-test -h | --help   # (this text)

Defaults:     base-period=25000nS servo-period=1000000nS
Equivalently: base-period=25µs servo-period=1ms

Times may be specified with suffix "s", "ms", "us" "µs", or "ns"
Times without a suffix and less than 1000 are taken to be in us;
other times without a suffix are taken to be in ns

The worst-case latency seen in any run of latency-test
is written to the file ~/.latency
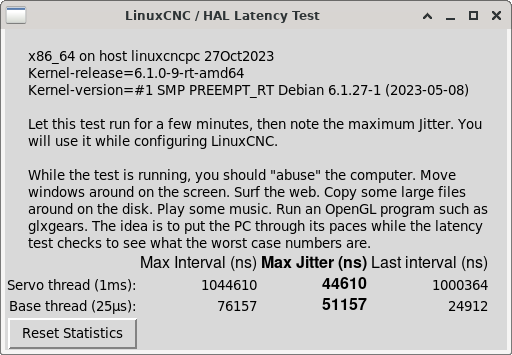
Fig. 17 LinuxCNC latency test tool.